FALL DETECTION SYSTEM
Students:
- Diego Cedrim Gomes Rêgo
- Yadira Garnica Bonome
Abstract
This paper presents important issues of the project of the course INF2541 - INTROD COMPUTACAO MOVEL- 2014.2. We propose system that detect when a person falls and send an alert to a contact list.
1. Introduction
In the last years the global population has been aging, and the care of those who are important to us: our parents, grandparents and family it’s one of the priority we have. Also in most families the elderly spend most of the time alone because the rest of the family is working. Falls in adults can cause serious injuries and even death if they are not treated urgently. The ability to automatically detect these fall events could help reducing the response time and significantly improve the prognosis of fall victims. The personal, social and economical effects of fall injuries make this an important global health concern. Reliable fall detection and emergency assistance notification are essential to provide adequate care and to increase the quality of life, especially among the elderly. This report presents a system that detect when a person falls and send an alert to a list of contact that can be the caregivers, the family or the paramedics. This report presents how the application was build and how experiments were performed.
In the Section 2 we present the objective of this work. In the Section 3 we present the system’s architecture and a discussion about implementations concerns. Following this section, in Section 4 we present how the experiments were performed and the results obtained. At the Section 5 we have the related work and in the section 6 we have the conclusions.
2. Objective
The objective of this work is to build an application that uses the SDDL Middleware as communication layer between the nodes to detect fall events and alert another interested user. We have two actors in the system: Monitored User and Caretaker. The caretaker is interested in fall events of Monitored User.
3. Architecture and Implementation
In this section we present how the application was built. We start with an overview about how the system works. After that, we present the architecture and its components.
3.1. Overview
As was presented in Section 1, the system is composed by two main Actors: Monitored User and Caretaker. The system collects all the time accelerometer and GPS data from a sensor tag used by the Monitored User. All this data is received and processed by one stationary node, that is responsible for analyzing the data looking for fall events. Beside of that, the stationary node always maintain the caretakers aware of the current status of the monitored user (location, fell or not). The application was implemented with the limitation of only one monitored user.
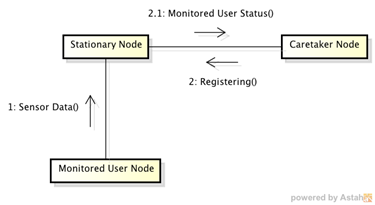
Messages are exchanged between nodes following the flow presented in Figure 1. In the first moment, the Stationary node is started and begins listening messages from mobile nodes. The Monitored User node has no user interaction, because the only thing it does is sending its sensor data (accelerometer and GPS) via SensorData message. From this moment, the stationary node begins to analyze the incoming sensor data looking for fall events.
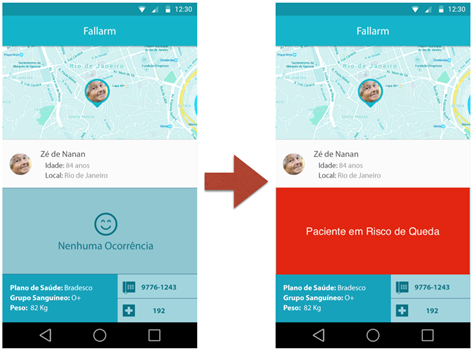
When a new caretaker node starts, the first thing it does is sending to the stationary node a special Registering message. This message tells to stationary node that a new caretaker is up and it want to know about the monitored user. The stationary node registers the new caretaker in its in-memory list and starts to send recurring messages about the monitored user (Monitored Status Message). The caretaker node is, in fact, an Android application that is responsible for receiving and interpreting the incoming messages. When the status of monitored user indicates a fall event, the app's interface changes to alert the caretaker.
3.2 Architecture
As we seen before, the architecture is composed by three main elements: Caretaker Node, Stationary Node and Monitored User Node. We omitted details of implementation in the prior section. In this section we present with details the architecture and implementations issues. We start presenting the High-Level Architecture and, after that, we detail all of its components.
3.2.1 High-Level Architecture
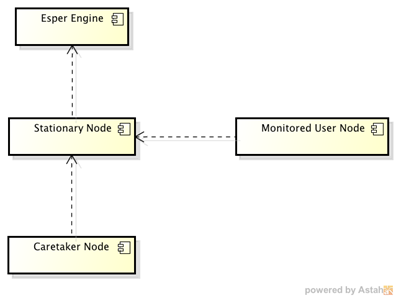
In the Figure 2 we can see the system’s high-level architecture. The following paragraphs details each one of the presented components.
Esper Engine
This component is responsible for analyzing the sensor data using an CEP (complex event processing) engine. We wrote a rule to express the conditions of fall events using the Esper language (in details in Section 4). When some data attends the conditions expressed by this rule, this engine notify the stationary node about this new event. With this information, the stationary node can notify all caretakers about it.
Stationary Node
Component responsible for implement the business rules and coordinate the message exchanges. This component is implemented as a node of SDDL core and the messages reach it through SDDL gateway. This node is a message receptor of all mobile nodes. An important responsibility of this node is to detect fall events using the data sent by the monitored user node. Each message of this kind is sent to Esper Egine component.
Monitored User Node
This node is responsible for sensor data collection in the source: the sensor tag attached to a monitored person. We did not implemented nothing in this component, because it is a simple hub. We used the LAC App Mobile Hub to connect to sensor tags and send all the collected data to the stationary node. That is the unique interaction between this component with stationary node.
Caretaker Node
This node is an Android application created from scratch. This application is responsible for showing the status of the monitored person. In its screen, the user can see where the monitored person is and his personal data (name, age, etc.).
3.2.2 Stationary Components
In this section we present in details the implementation of two components: Stationary Node and Esper Engine. In the Figure 3 we can see the main classes that implements the stationary components (Esper Engine and Stationary Node). The classes Elder, Caretaker and SensorData represents the domain model related to the problem solved by the system. The class Elder and SensorData express the current status of the monitored node.
The core class of these component is FallServer. This class is responsible for receiving and sending messages from/to mobile nodes. When a new message comes from the monitored node, the method registerNewElderData is called. This method updates the single Elder instance with the new data and sends the same data to Esper Engine, that is represented by FallCEPService class. When a new message comes from a caretaker node, the method registerNewCaretaker.
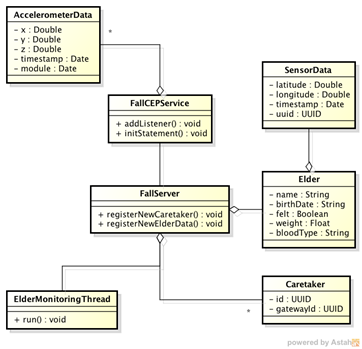 Figura 3: Stationary Components
is called to add the new caretaker to the list maintained in memory. This component has a dedicated thread responsible for updating and broadcasting the status of the monitored node. On each ten seconds, the ElderMonitoringThread instance sends the Elder instance to all registered caretakers. This is useful to caretakers because, in this way, they can see, in real time, the position in the map of the monitored node.
The FallCEPService class abstracts the interaction with Esper Engine. The unique instance of this class is notified by the FallServer instance on each new SensorData received. All SensorData instances is converted to a AccelerometerData instance. This special instance has only data related to accelerometers with the particularity that it stores two additional information: module and time stamp of data generation. The module field is calculated by ![]() where x, y and z are the accelerations on each axis. These data is used to detect a fall event.
where x, y and z are the accelerations on each axis. These data is used to detect a fall event.
We consider that the monitored node fell if its accelerometer data exceeds one of the determined thresholds (mode details in Section 4). If one of the thresholds is exceeded by the monitored node, we start to analyze the following data. If this data is sustained stable near the “no activity” thresholds, we consider the event as a fall. This behavior simulates a fast acceleration followed by a long lay state, i.e., the monitored node fell (fast acceleration) and then stayed in floor motionless. The following Esper rule was used during experiments.
SELECT
            *
FROM
           AccelerometerData base
WHERE
           (base.module >= UPPER_FALL_THRESHOLD
           OR base.module <= LOWER_FALL_THRESHOLD)
           AND UPPER_LAY_THRESHOLD >= ALL(
                   SELECT module
                   FROM AccelerometerData.win:TIME(5 sec)
                   WHERE
                   TIMESTAMP > base.timestamp)
           AND LOWER_LAY_THRESHOLD <= ALL(
                   SELECT module
                   FROM AccelerometerData.win:TIME(5 sec)
                   WHERE
                   TIMESTAMP > base.timestamp)****
3.2.3 Caretaker Node
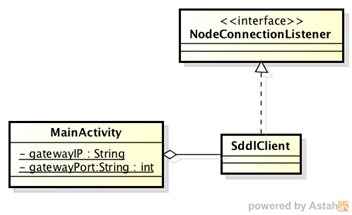
In the Figure 4 we can see the classes we used to implement the caretaker Android app. The application has only one Activity that is responsible for presenting all the data of monitored node. The class MainActivity is called when the application starts and it is responsible for starting SddlClient class, that is a separate thread created to interact with stationary node.
The SddlClient instance registers the caretaker during the application startup. After that, this same instance receives all status updates from stationary node. On each new data received, this instance calls the setElder method of MainActivity to perform interface changes. The interface has only two states: monitoring and fall detected. These two states can be seen in the Figure 5.
4 Experiments
We need determinate when an event of type “fall” occurs: first the accelerometer data is upper or lower than the “fall” thresholds and then the accelerometer data is maintained around the “no activity” thresholds.
The general objective of the experiments is determinate the right values for the thresholds that are used at the Esper rule. The experiments are divided in 2 phase s: Calibration of thresholds and Test of thresholds.
These thresholds are:
- UPPER_FALL_THRESHOLD
- LOWER_FALL_THRESHOLD
- UPPER_LAY_THRESHOLD
- LOWER_LAY_THRESHOLD
We did 4 experiments divided in the following way:
- 3 experiments in the calibration phase:
- 2 for determinate the correct values of the thresholds
- 1 for validate the Fall thresholds and
- 1 experiment for the test of thresholds using Esper rule.
4.1 Calibration of thresholds
4.1.1 Experiment 1
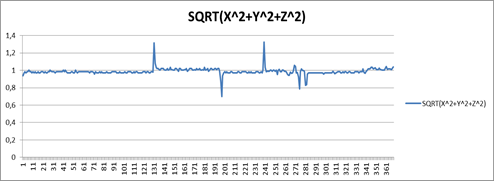
In the first experiment we define the correct values for the Lay thresholds. We put the accelerometer in inactivity state only varying the orientation of the axis simulating a person that move very slowly over the floor and collected the accelerometer data during approximately 3 minutes at a frequency of one sample per half second for a total of 369 samples. Then we calculate the maximum and minimum values of acceleration (module(x, y, z)), the mean and the standard deviation. The values obtained were MEAN: 0,987053732, STANDARD DEVIATION: 0,043657314, MAX: 1,325917283, MIN: 0,698281932. We detect that the maximum and minimum values are out of the range [mean+sd, mean-sd] and so we decide that the better thresholds are the maximum and minimum values.
Formalization
- Objective: Determinate the correct values for the Lay thresholds.
- Set-up: accelerometer in inactivity state, recording of the values of the accelerometer during approximately 3 minutes at a frequency of one sample per half second for a total of 369 samples
- Parameters to be varied: change the orientation of the axis of accelerometer simulating a person that move very slowly over the floor
- Metrics:
module(x,y,z)= ![]() ,
meam(module(x,y,z)) ,
standar_deviation(module(x,y,z)),
Min(module(x,y,z)),
Max(module(x,y,z))
,
meam(module(x,y,z)) ,
standar_deviation(module(x,y,z)),
Min(module(x,y,z)),
Max(module(x,y,z))
- Results: We detect that the maximum and minimum values are out of the range [mean+sd, mean-sd] and so we decide that the better thresholds are the maximum and minimum values.
MEAN: 0,987053732
STANDARD DEVIATION: 0,043657314
MAX: 1,325917283
MIN: 0,698281932
4.1.2 Experiment 2
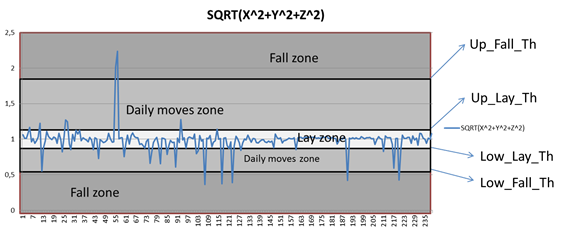
In the second experiment we define the correct values for the Fall thresholds. We put the accelerometer in the poked of pants, and executed standard daily activities such as stand, sit, walk, in different orders and repeatedly; collecting the accelerometer data during approximately 2 minutes at a frequency of one sample per half second for a total of 234 samples. Then we calculate the maximum value and minimum value of acceleration (module(x, y, z)), the mean and the standard deviation. The values obtained were MEAN: 0,987490079, STANDARD DEVIATION: 0,129584083, MAX: 1,855629105, MIN: 0,512538108. We detect that the maximum and minimum values are out of the range [mean+sd, mean-sd] and so we decide that the better thresholds are the maximum and minimum values.
Formalization
· Objective: define the correct values for the Fall thresholds.
· Set-up: accelerometer in the pocket of pants, recording of the values of the accelerometer during approximately 2 minutes at a frequency of one sample per half second for a total of 234 samples.
· Parameters to be varied: the activities of the person: none, stand, sit and walk.
· Metrics:
module(x,y,z)= √(x^2+y^2+z^2 ),
meam(module(x,y,z)) ,
standar_deviation(module(x,y,z)),
Max(Module(x,y,z)),
Min(Module(x,y,z)).
· Results: We detect that the maximum and minimum values are out of the range [mean+sd, mean-sd] and so we decide that the better thresholds are the maximum and minimum values.
MEAN 0,987490079
STANDARD DEVIATION 0,129584083
MAX 1,855629105
MIN 0,512538108
4.1.3 Experiment 3
In the third experiment we validate the thresholds found in the second experiment with accelerometer data that contain values of fall. For that we put the accelerometer at the height of the pocket of pants, and throw it on the floor for 6 times and between each time we performed different activities such as stand, sit, walk. We collected the accelerometer data during 2 minutes at a frequency of one sample per half second for a total of 239 samples. We calculated the mean of the module and then we created a function that detect the falls in the same way that the Esper Rule, with the Fall Threshold.
Formalization
- Objective: validate the thresholds found in the second experiment with accelerometer data that contain values of fall, creating a function fall(x) that detect the falls in the same way that the Esper Rule.
- Set-up: accelerometer at the height of the pocket of pants, and throw it on the floor for 6 times and between each fall we performed different activities such as stand, sit, walk. We collected the accelerometer data during 2 minutes at a frequency of one sample per half second for a total of 239 samples.
- Parameters to be varied: activities performed: none, walk, sit, stand and fall
- Metrics:
- Results: As result, all the 6 times the function detects the fall.
4.2 Test of thresholds
In the fourth experiment we test the precision of the thresholds and the Esper rule with accelerometer data that contain values of fall. For that we put the accelerometer at the height of the pocket of pants, and throw it on the floor for 60 times and between each time we performed different activities such as stand, sit, walk. The Esper rule with these thresholds (Fall and Lay) detects a fall correctly in 19 times, for a precision of 31%. We also detected that from the 41 fail, 38 was at the upper fall threshold, giving a 92% of errors related to this threshold.
4.2.1 Experiment 4
- Objective: Determinate the precision of the Esper rule with the calibrated thresholds.
- Set-up: Accelerometer at the height of the pocket of pants.
- Parameters to be varied: activities performed: none, walk, sit, stand, fall
- Results: The Esper rule with these thresholds (Fall and Lay) detects a fall correctly in 19 times, for a precision of 31%. We also detected that from the 41 fail, 38 was at the upper fall threshold, giving a 92% of errors related to this threshold.
[2] M. A. Habib, M. S. Mohktar, S. B. Kamaruzzaman, K. S. Lim, T. M. Pin, and F. Ibrahim, “Smartphone-based solutions for fall detection and prevention: challenges and open issues.,” Sensors (Basel)., vol. 14, no. 4, pp. 7181–208, Jan. 2014.
This paper presents a state-of-the-art survey of smartphone (SP)-based solutions for fall detection and prevention. Fall detection and fall prevention systems have the same basic architecture. Both systems follow three common phases of operation: sense, analysis and communication. The basic difference between the two systems lies in their analysis phase with differences in their feature extraction and classification algorithms. Fall detection systems try to detect the occurrence of fall events accurately by extracting the features from the acquired output signal(s)/data of the sensor(s) and then identifying fall events from other activities of daily living (ADL). On the other hand, fall prevention systems attempt to predict fall events early by analyzing the outputs of the sensors. Data/signal acquisition, feature extraction and classification, and communication for notification are the necessary steps needed for both fall detection and prevention systems. The number and type of sensors and notification techniques however, vary from system to system.
 Most solutions employ the tri-axial accelerometer for sensing which measure simultaneous accelerations in three orthogonal directions. Threshold-based algorithms use these acceleration values for calculating Signal Magnitude Vector by using the following relation:
![]() Where Ax, Ay, and Az represent tri-axial accelerometer signals of the x, y, and z-axis respectively. If the value of signal magnitude vector for a particular incident exceeds a predefined threshold value, then the algorithm primarily identifies that incident as a fall event.
Where Ax, Ay, and Az represent tri-axial accelerometer signals of the x, y, and z-axis respectively. If the value of signal magnitude vector for a particular incident exceeds a predefined threshold value, then the algorithm primarily identifies that incident as a fall event.
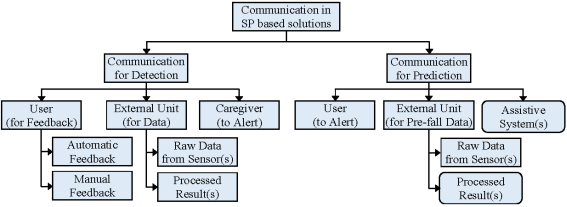
Whenever a SP-based solution detects or predicts a fall event, it communicates with the user of the system and/or caregivers. Most fall detection solutions carry out this communication phase in two steps. In the first step, the system attempts to obtain feedback from the user by verifying the preliminary decision and thus improve the sensitivity of the system. The second step depends on the user’s response. If the user actively rejects the suspected fall, then the system restarts. Otherwise, a notification is sent to caregivers to ask for immediate assistance. Some systems may not wait for user’s feedback and will immediately convey an alert message to the caregiver. User’s feedback can be collected automatically by analyzing the sensor’s output for example automatically analyzing the difference in position-data before and after the suspected fall event. Other systems demand manual feedback from the user.
Smartphone-based solutions can also be categorized on the basis of algorithms used in the analysis phase.
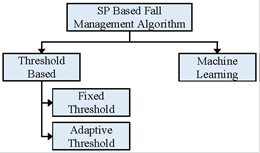 Existing and potential SP-based fall detection and prevention systems communicate with the users, caregivers or assistive systems by sending alert signals, obtaining user or system feedback or activating assistive systems.
[3] W. Putchana, S. Chivapreecha, and T. Limpiti, “Wireless intelligent fall detection and movement classification using fuzzy logic,” 5th 2012 Biomed. Eng. Int. Conf., pp. 1–5, Dec. 2012.
In this paper they propose a wireless intelligent system prototype for fall detection and movement classification for real-time monitoring of the elderly. The portable sensor unit acquires data from a tri-axial accelerometer and sends the data wirelessly to a computer using Zigbee technology. Alternative to classic methods, the movement data is analyzed using a fuzzy inference system. The system is designed to distinguish between four movement types: standing, sitting, forward fall, and backward fall. Its classification accuracy is investigated using experimental data. It is observed that the system performs well with high sensitivity and excellent specificity. Additionally, the system is applicable for monitoring rehabilitative patients and is extendable to a larger class of movements and postures.
[4] G. Vavoulas, M. Pediaditis, E. G. Spanakis, and M. Tsiknakis, “The MobiFall dataset: An initial evaluation of fall detection algorithms using smartphones,” 13th IEEE Int. Conf. Bioinforma. Bioeng., pp. 1–4, Nov. 2013.
This work introduce a human activity dataset that will be helpful in testing new methods, as well as performing objective comparisons between different algorithms for fall detection and activity recognition, based on inertial sensor data from smartphones. The dataset contains signals recorded from the accelerometer and gyroscope sensors of a latest technology smartphone for four different falls and nine different activities of daily living. Using this dataset, the results of an initial evaluation of three fall detection algorithms are finally presented. The MobiFall dataset contains data from 11 volunteers: six males (age: 22-32 years, height: 1.69-1.89 m, weight: 64-102 kg) and five females (age: 22-36 years, height: 1.60-1.72 m, weight: 50-90 kg). Nine participants performed falls and ADLs, while two performed only the falls. This article evaluates three algorithms that have been reported in connection to fall detection based on mobile phone or smartphone devices only.
One of the algorithms uses the magnitude Mi of the acceleration vector at each ith sample:
![]() Where xi, yi and zi are the accelerations in the respective axes. A fall is suspected if a lower (TH1a) and an upper (TH1b) threshold are crossed in a given short duration of time (W1a). These thresholds are adjusted based on user age, weight, height and level of activity. After this phase, the algorithm checks if the orientation2 changed (TH1c) with respect to the last orientation, recorded while the phone was resting at M= 1 g for a long period of time (W1b), before the threshold crossing. Finally, if the changed position remains constant (TH1d) for another given time window (W1c), in order to account for the fact that the person may stand up again, then a fall is detected.
Where xi, yi and zi are the accelerations in the respective axes. A fall is suspected if a lower (TH1a) and an upper (TH1b) threshold are crossed in a given short duration of time (W1a). These thresholds are adjusted based on user age, weight, height and level of activity. After this phase, the algorithm checks if the orientation2 changed (TH1c) with respect to the last orientation, recorded while the phone was resting at M= 1 g for a long period of time (W1b), before the threshold crossing. Finally, if the changed position remains constant (TH1d) for another given time window (W1c), in order to account for the fact that the person may stand up again, then a fall is detected.
[5] A. K. Bourke, J. V O’Brien, and G. M. Lyons, “Evaluation of a threshold-based tri-axial accelerometer fall detection algorithm.”, Gait Posture, vol. 26, no. 2, pp. 194–9, Jul. 2007.
This paper describes the development and testing of a threshold-based algorithm capable of automatically discriminating between a fall-event and an ADL, using tri-axial accelerometers. The accelerometer signals were acquired from simulated falls performed by healthy young subjects and from activities of daily living performed by elderly adults in their own homes.
The simulated fall study involved 10 young healthy young subjects performing simulated falls onto large crash mats. The second study involved elderly subjects performing ADL, in their own homes, while fitted with the same sensor configuration.
The 20 participants were fitted with the tri-axial accelerometer sensors located at the anterior aspect of the trunk, at the sternum and, at the anterior of the thigh at the midpoint of the femur.
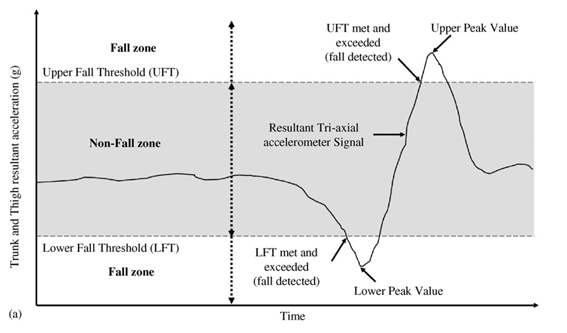
The resultant signal from both the tri-axial accelerometer sensors at the trunk and the thigh was derived by taking the root-sum-of-squares of the three signals from each tri-axial accelerometer recording. When stationary, the root-sum-of-squares signal from the tri-axial accelerometers is a constant +1 g. The upper and lower fall thresholds for the trunk and thigh were derived as follows:
- Upper fall threshold: positive peaks for the recorded signals for each recorded activity are referred to as the signal upper peak values (UPVs). The upper fall thresholds (UFT) for each of the trunk and thigh signals was set at the level of the smallest magnitude upper fall peak (UFP) recorded for both of the trunk and thigh resultant vector signals individually. These UFT levels would thus result in 100% detection of the 240 falls recorded for each of the resultant vector signal thresholds individually. The UFT is related to the peak impact force experienced by the body segment during the impact phase of the fall.
- Lower fall threshold: negative peaks for the resultant for each recorded activity are referred to as the signal lower peak values (LPVs). The lower fall thresholds (LFT) for the trunk and thigh signals were set at the level of the smallest magnitude lower fall peak (LFP) recorded for the trunk and thigh resultant vector signals. These levels of LFT would thus result in 100% detection of the 240 falls recorded for each of the resultant vector signal thresholds individually. The LFT is related to the acceleration of the trunk at or before the initial contact of the body segment with the ground.
6. Conclusion
We build an application that uses the SDDL Middleware as communication layer between the nodes to detect fall events and alert another interested user. The thresholds define for the detection of the falls, had a precision of 31%, and 92% of the errors depends on the upper fall threshold, so we propose for future work perform some more experiments and try to improve this threshold and the precision.
